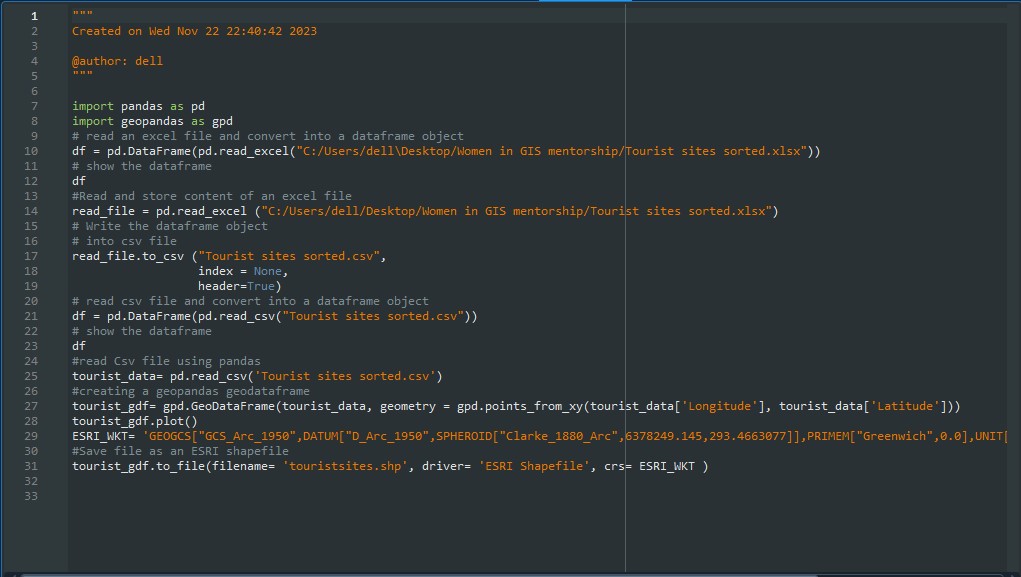
Tourist site data for Zimbabwe, stored in a CSV file, was converted into a geospatial shapefile using Python and GeoPandas. This workflow demonstrates how tabular coordinate data can be transformed into a fully functional vector layer ready for GIS analysis and mapping.
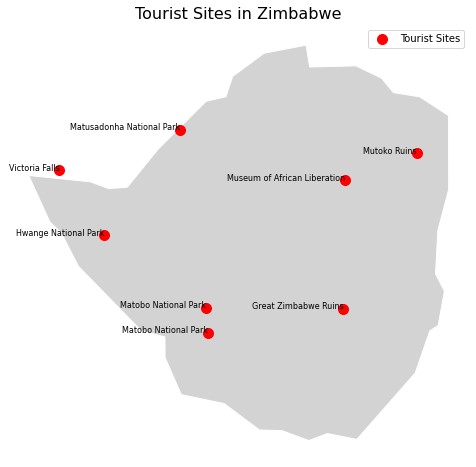
An interactive map displaying tourist sites across Zimbabwe was created using the GeoPandas and Matplotlib libraries in Python. The project demonstrates how open geospatial data can be visualised programmatically, producing a clean, publication-ready map without any desktop GIS software.
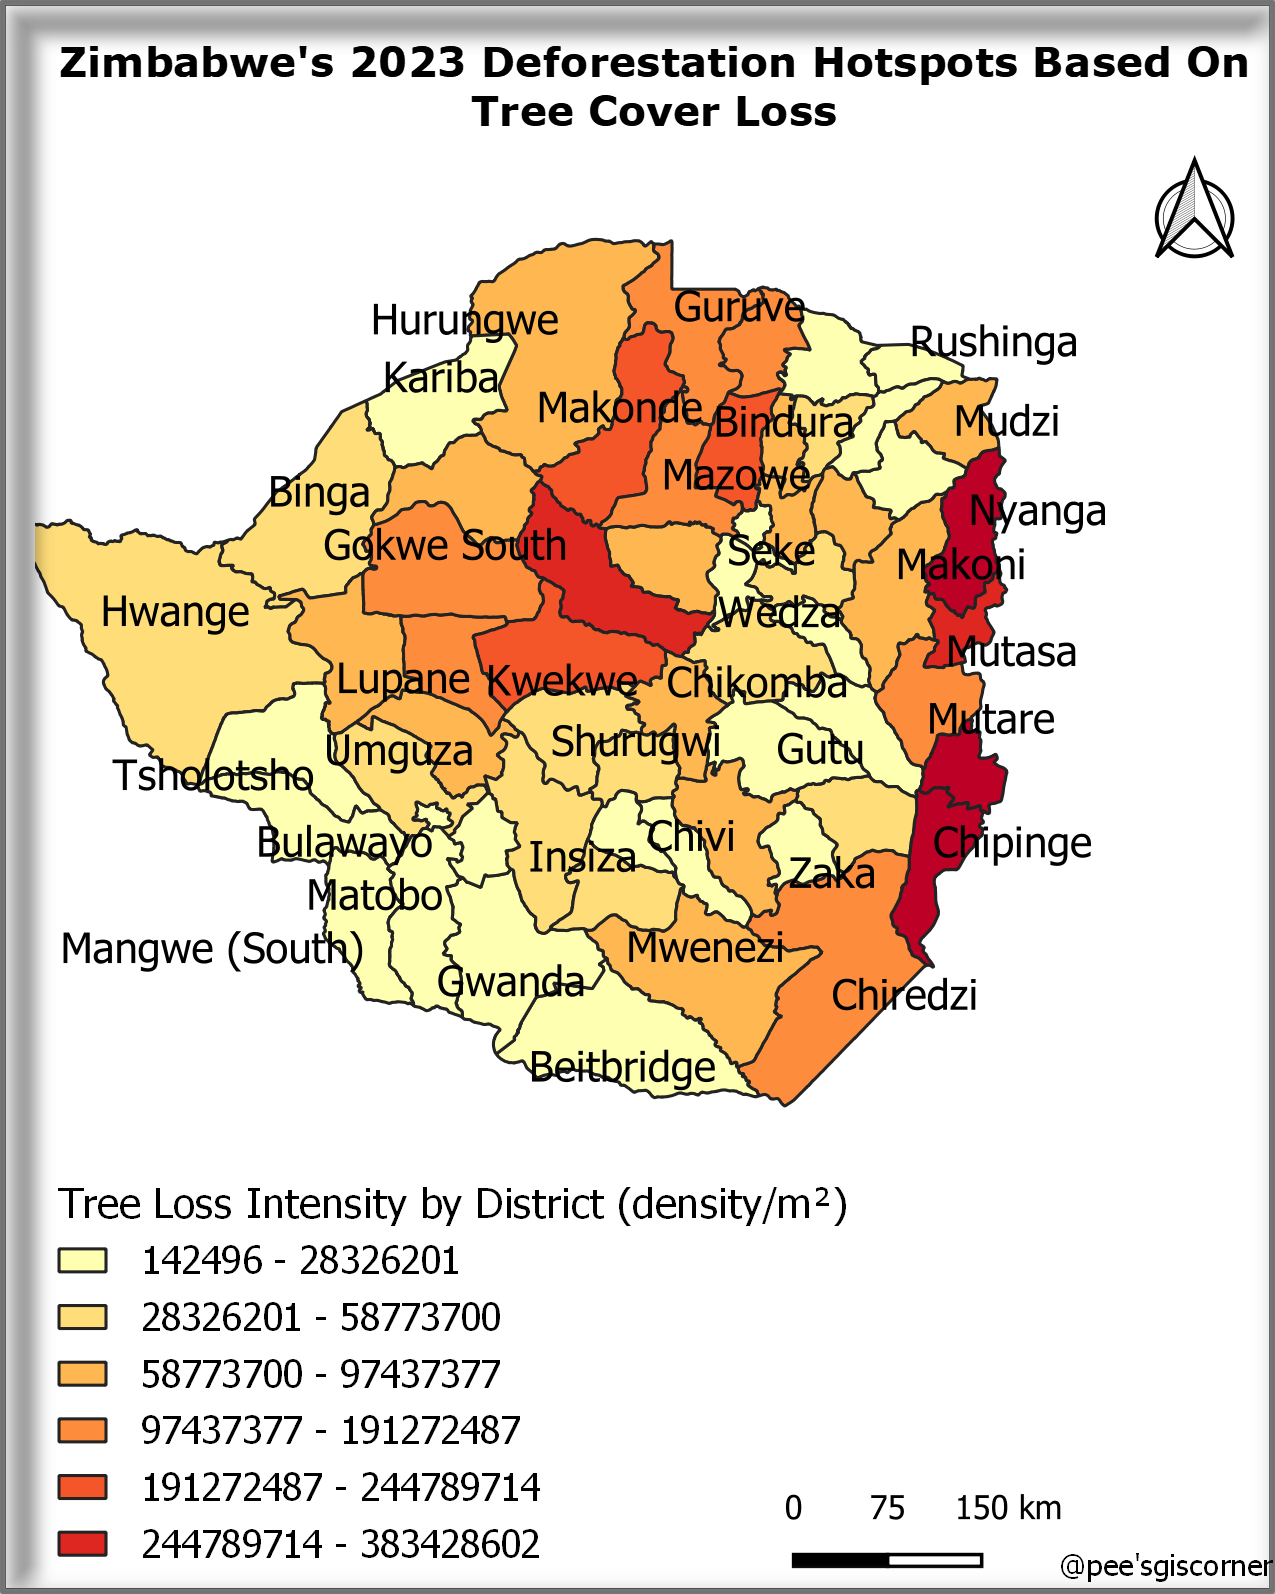
Using tree cover loss data from 2023, deforestation hotspots across Zimbabwe were identified and mapped in QGIS. The analysis involved data processing, spatial statistics, and cartographic visualisation — providing actionable insights for conservation planning and environmental monitoring.
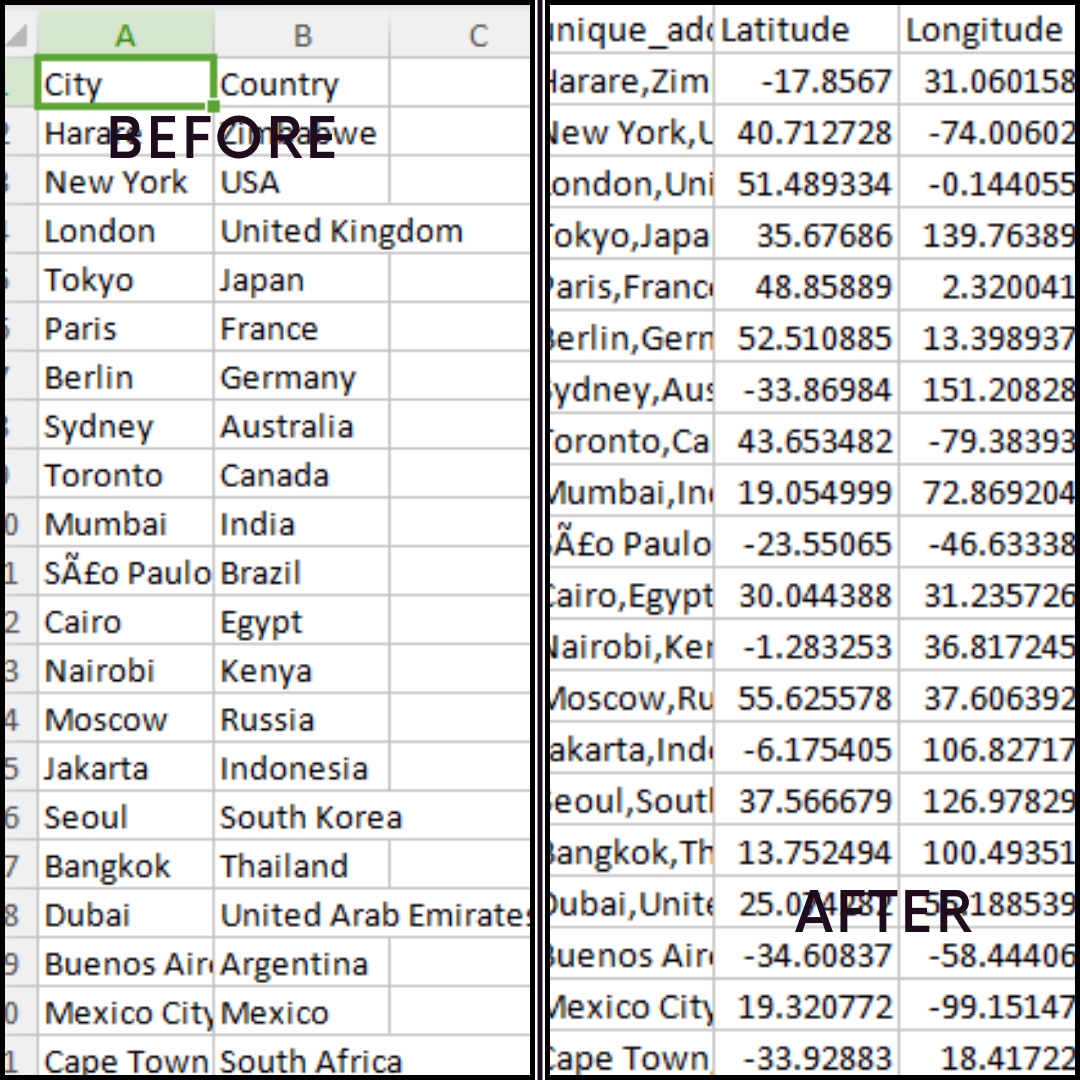
A list of world cities was geocoded using Python and the Nominatim API, converting place names into geographic coordinates. The project demonstrates a practical automation workflow for enriching datasets with spatial information — a common requirement in GIS data preparation pipelines.